The cost of poor retail execution: 2026 statistics (sourced)
How much does poor retail execution actually cost? 43% of retail leaders can name sales they lost to it, and only 36% say most initiatives execute correctly. The 2026 numbers, each one sourced and dated.
The short answer: in a 2026 survey of 227 retail leaders, 43% could point to sales they had lost directly to poor execution, and only 36% said more than three-quarters of their initiatives execute correctly and on time. So the honest headline is this: most retail leaders can't say with confidence that most of their initiatives land, and nearly half can name revenue they'll never get back. There is no single agreed dollar figure for the cost of poor retail execution, and anyone quoting one precisely is guessing. What the data does show, consistently, is a large and measurable gap between what stores are asked to do and what actually happens on the floor.
Below are the numbers worth trusting in 2026, each one sourced and dated, with a note on whether it's a measured result or a self-reported perception. Most existing pages on this topic recycle a single 2016-era figure. These don't.
The execution gap
How often initiatives actually land, and why they don't.
Only 36% of retail leaders say more than three-quarters of their initiatives execute correctly and on time. (2026 survey of 227 retail leaders, US/Canada. Self-reported.)
43% report lost sales directly attributable to poor execution. (Same survey.)
51% — insufficient staffing is the single most-cited reason initiatives fail, ahead of any other cause. (Same survey.) Sit with that for a second. The top reason execution breaks isn't defiance or carelessness. It's that there aren't enough people to do the work. We wrote about why the frontline gets blamed for a system failure in Marked done isn't done.
The store data blind spot
Poor execution and poor sight of the floor are the same problem seen from two angles. You can't fix what you can't see.
HQ rates its own understanding of store operations at 9.1 out of 10. Store leaders rate HQ's understanding at 5.7. (2026 survey of 227 retail leaders. Self-reported perception on both sides, which is exactly the point: the two ends of the same business disagree by nearly three and a half points.)
70% of store leaders say they lack a clear way to raise concerns with HQ. (Same survey.)
~25% of retailers have full sight of their store-related functions. (Coresight Research, "State of In-Store Retailing 2025." Medium confidence: a research finding, and the study is sponsor-linked, so read it as directional rather than precise.) Turned around, roughly three in four retailers are running their most valuable channel partly in the dark.
We go deeper on this asymmetry, why the website knows everything and the store knows almost nothing, in The store data blind spot.
What it costs: the everyday failures
The blind spot shows up in the ordinary things stores are asked to get right. In a 2024 study, retailers reported ongoing challenges across in-store operations at strikingly high rates:
Price and promotion execution — 96% report challenges.
Planogram compliance — 93%.
Out-of-stocks — 92%.
(Coresight Research / Simbe, 2024. n=150 US decision-makers at retailers with $100M+ revenue. These are self-reported operational challenges, not audited error rates. But the range across the board, 88–96%, tells you this is near-universal, not a niche complaint.)
None of these is exotic. They are the daily mechanics of running a floor. Nearly every retailer says they struggle with them, and almost none can see them clearly enough to say where, or why.
What it costs: labour and shrink
Two more places the cost lands. Both are real, both easy to overstate, so here they are with the caveats attached.
Frontline retention tracks sales. Stores with the best frontline retention see same-store sales growth 2–5 percentage points above average. (McKinsey, 2023. This is a correlational analyst finding, not a causal claim. Better-run stores tend to keep staff and sell more, and the two reinforce each other. Cite it as a relationship, not a lever you pull.)
Retail crime is elevated and now a board-level issue. A US survey put shoplifting incidents up 18% year on year and violence during theft up 17%. (NRF 2025 loss-prevention executive survey. US only, and self-reported by LP executives. Independent 2025 data shows some categories declining, so the honest framing is "elevated and on the boardroom agenda," not "accelerating unchecked.")
The through-line: execution, labour and loss aren't separate problems. A store that can't hold its people struggles to execute; a store that can't execute leaks margin in ways the numbers only reveal weeks later, when it's too late to act.
Why now: AI and margin pressure
The reason this is a 2026 story and not a 2016 one is that the ground under it has shifted.
~68% of retail executives — and 86% at companies over $1B in revenue — expect to deploy agentic AI in their operations within the next 12–24 months. (Deloitte 2026 Retail Outlook, n=330.)
71% of retail executives say cost control is what drives their competitive edge; 44% say legacy systems are slowing their ability to innovate. (Same report.)
On the upside: available AI can halve the time spent on some store tasks. (McKinsey, 2023. An analyst estimate of technical potential, not a measured ROI figure. Treat it as a ceiling, not a promise.)
Here's the catch that ties the AI numbers to the execution numbers. An AI can't optimise, or even reason about, a store network it has no structured record of. The same floor that's invisible to HQ today is invisible to the agent you're planning to deploy next year. The execution gap isn't just costing sales now. It's the missing foundation under every AI plan on the roadmap.
The number nobody has yet
One number is missing from every figure above. The industry can quote the cost of poor store execution all day, but almost nobody measures the return on getting it right. There is no clean, first-party number for the financial impact of store execution: the in-store attribution that says this action, in these stores, earned this much. That's why the ROI of retail technology stays a guess for most retailers. You can't attribute a result to a floor you can't see. Closing that gap, action by action, is exactly what Piing is built to do, and it's the number this whole page is really pointing at.
How these numbers are sourced
This page only carries numbers we can stand behind, so here is plainly what they are and aren't.
Dates. Every stat is dated inline. The core execution figures are from 2026; the operational-challenge and labour figures are 2024–2025; nothing here relies on the pre-2020 numbers most competing pages still quote.
Perception vs. measured. We flag which is which. The 36% / 43% / 51% figures and the 9.1-vs-5.7 gap are self-reported perceptions from retail leaders, powerful because they show what operators believe, but not audited outcomes. The Coresight/Simbe and Deloitte figures are survey findings with stated sample sizes. The McKinsey figures are analyst analysis, correlational or estimative, not measured ROI.
Scope and sponsorship. Most of this data is US and Canadian. The Coresight visibility figure is sponsor-linked; the shrink figures are from a loss-prevention body and self-reported. We say so rather than launder it into false precision.
What we won't do. We won't invent a headline dollar cost, and we won't quote the "around 80% of revenue runs through physical stores" figure as if it were a precise citation. It's a sound industry generalisation, and we use it as one.
The AU/NZ gap
Almost all the hard data above is US and UK. There is, as of 2026, no published execution benchmark specific to Australia or New Zealand: no local equivalent of the 227-leader survey, no ANZ read on how often initiatives land across a real estate of stores.
That's not a small omission. AU/NZ retail runs on the same physics: briefs going out to a network, a floor that changes shift by shift, roughly the same share of revenue crossing the physical store. But leaders here are forced to reason from overseas numbers and hope they transfer. Closing it, with real ANZ execution data, is exactly what Piing intends to do.
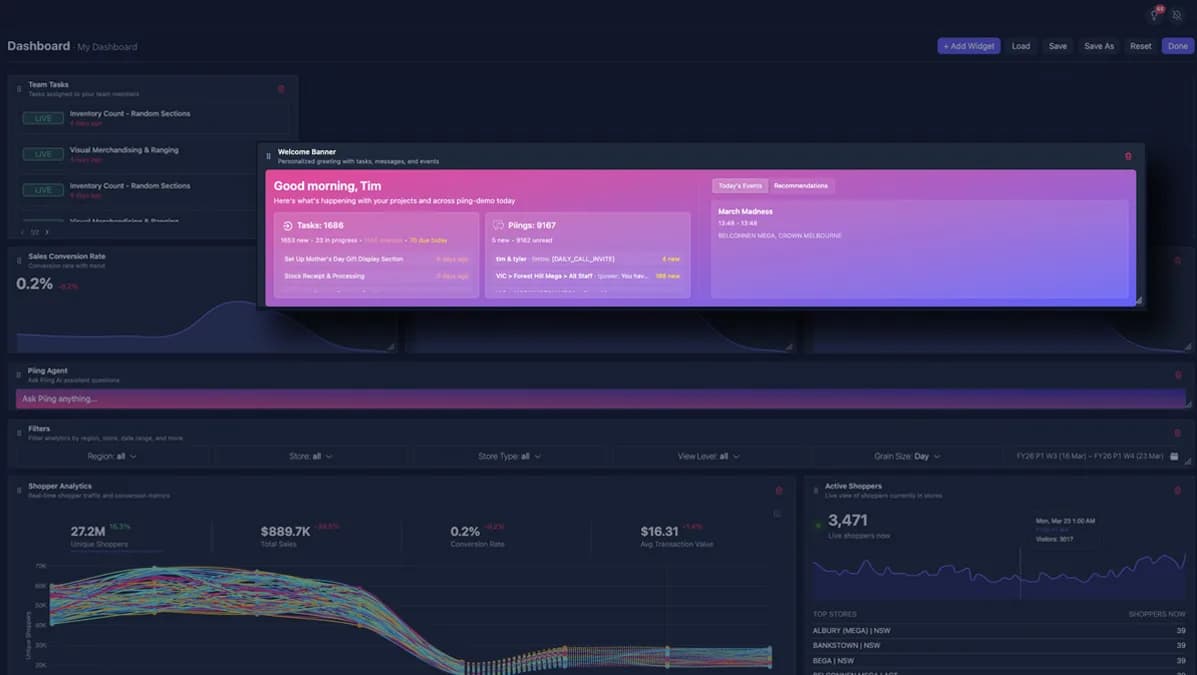
Piing is the context engine for retail: it turns store-floor reality into a structured, real-time record, and connects every action to the outcome it drove. You see not just what was marked done, but what it earned. *See your estate come alive →*
See what your network is actually doing today.
A working session on one network: where the performance is leaking, and what the measurement would have to show to prove it closed.